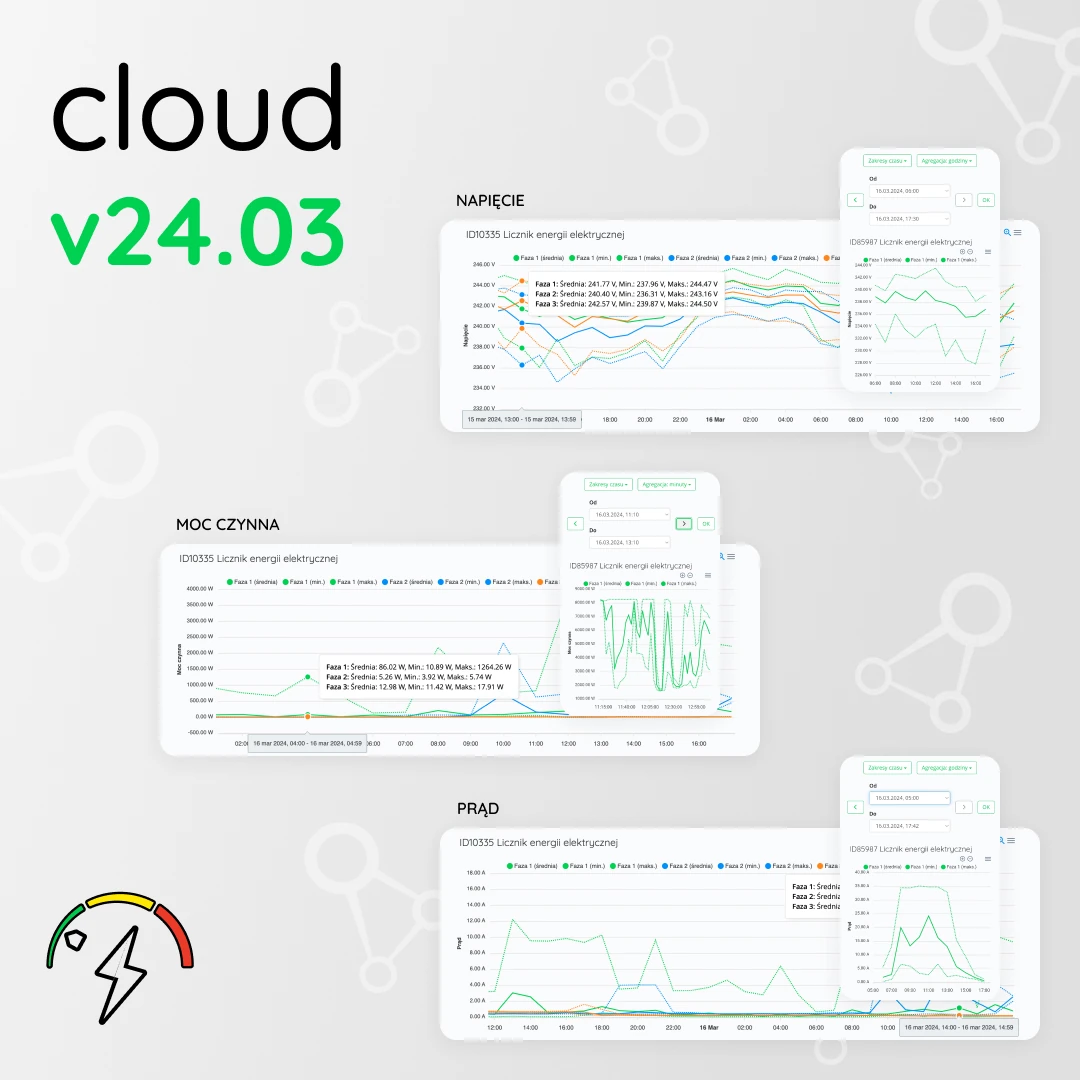
Following user feedback, with the release of cloud version 24.03 we introduced history charts for voltage, current, and active power.
This is a natural extension of our existing analytical features, including voltage anomaly monitoring, which is especially appreciated by PV owners. The new charts make it easier to analyze installation behavior and spot unwanted events more quickly.
The new views are already available at cloud.supla.org, and they will soon appear in the Android and iOS apps as well.